在行为学研究中,我们经常需要可视化动物的运动轨迹,以便分析其速度、位置分布和行为模式。
但直接使用三维坐标的原始数据绘图,可能出现个别帧的漂移数据导致整个轨迹图的变形与错位,严重时会导致整个样本的热图不可用。
本文将介绍如何使用 Python 从 3D 骨架数据(BA-Analyzer处理得到的h5 文件)提取小鼠的背部坐标,对原始数据进行平滑与滤波后,绘制速度轨迹热图与位置热图。教程涵盖平滑与滤波参数设置、colorbar 手动调节、热图底色优化等细节,使绘图结果既美观又科学。
准备工作
使用代码前请安装好python,以及代码依赖的库:numpy, matplotlib, scipy, seaborn(可以通过pip install packagename指令进行库的下载)
import os
import h5py
import numpy as np
import matplotlib.pyplot as plt
from scipy.signal import savgol_filter, butter, filtfilt
from scipy.ndimage import gaussian_filter
参数设置
代码中必须修改设置的是h5文件夹路径data_path和结果图保存路径save_path
可以选择修改的是滤波与平滑的参数、速度轨迹热图和位置热图的colorbar数值范围和colormap颜色。
data_path = r"D:\BA_test\results"   # 修改: h5 文件夹路径
save_path = r"D:\BA_test\results_report"  # 修改:为结果保存路径

# 滤波参数
# Savitzky–Golay 滑动平滑:在每个窗口内用多项式拟合点,然后取拟合值代替原数据,实现平滑
savgol_window = 9    # 必须为奇数,数值越大平滑效果越强
savgol_poly = 3      # 数值越大,保留更多局部波动
# Butterworth 低通滤波:去掉高频噪声,保留低频平滑运动趋势
butter_cutoff = 6    # 数值越大,滤除更多高频波动,更平滑
butter_order = 3     # 数值越大,滤波器陡峭更严格

speed_clim_manual = (0, 100)   # 修改:设置速度轨迹热图 colorbar 范围 [min, max];设为 None 使用所有样本的最大值
pos_clim_manual = (0, 0.001)  # 修改:设置位置热图 colorbar 范围 [min, max]

# colormap
colormap = plt.cm.RdBu_r
完整代码
对应修改完上述参数后即可运行完整代码:
# -*- coding: utf-8 -*-
"""
Created on Tue Oct 28 16:22:30 2025

@author: Shihua
"""

import os
import h5py
import numpy as np
import matplotlib.pyplot as plt
from scipy.signal import savgol_filter, butter, filtfilt
from scipy.ndimage import gaussian_filter

# ============================
# 参数设置
# ============================
data_path = r"D:\BA_test\smoothed_speed_position_heatmap\results"   # ⚠️修改:为你的 h5 文件夹路径
save_path = r"D:\BA_test\smoothed_speed_position_heatmap\results_report"   # ⚠️修改:为结果保存路径

# 滤波参数
# Savitzky–Golay 滑动平滑:在每个窗口内用多项式拟合点,然后取拟合值代替原数据,实现平滑
savgol_window = 9    # 必须为奇数,数值越大平滑效果越强
savgol_poly = 3      # 数值越大,保留更多局部波动
# Butterworth 低通滤波:去掉高频噪声,保留低频平滑运动趋势
butter_cutoff = 6    # 数值越大,滤除更多高频波动,更平滑
butter_order = 3     # 数值越大,滤波器陡峭更严格

speed_clim_manual = (0, 100)   # 修改:设置速度轨迹热图 colorbar 范围 [min, max];设为 None 使用所有样本的最大值
pos_clim_manual = (0, 0.001)  # 修改:设置位置热图 colorbar 范围 [min, max]

# colormap
colormap = plt.cm.RdBu_r

# ============================
# 滤波函数定义
# ============================
def butter_lowpass_filter(data, cutoff, fs, order=3):
    nyq = 0.5 * fs
    normal_cutoff = cutoff / nyq
    b, a = butter(order, normal_cutoff, btype='low', analog=False)
    return filtfilt(b, a, data)

# ============================
# 主处理流程
# ============================
# 用于计算全局速度最大值
all_speeds_max = []

# 先遍历计算速度最大值(如果需要手动统一 colorbar)
for file in os.listdir(data_path):
    if not file.endswith(".h5"):
        continue

    file_path = os.path.join(data_path, file)
    with h5py.File(file_path, 'r') as f:
        data3D = np.array(f["3Dskeleton/data3D"])
        bodyparts = [bp.decode('utf-8') for bp in f["3Dskeleton/Bodyparts"][:]]
        fps = float(f["3Dskeleton/FPS"][()])

    if "back" not in bodyparts:
        continue
    back_idx = bodyparts.index("back")
    back_xyz = data3D[:, back_idx*3:(back_idx+1)*3] / 10.0

    smoothed = savgol_filter(back_xyz, window_length=savgol_window, polyorder=savgol_poly, axis=0)

    filtered = np.zeros_like(smoothed)
    for i in range(3):
        filtered[:, i] = butter_lowpass_filter(smoothed[:, i], butter_cutoff, fps, butter_order)

    velocity = np.gradient(filtered, axis=0) * fps
    speed = np.linalg.norm(velocity, axis=1)
    all_speeds_max.append(speed.max())

global_speed_max = max(all_speeds_max) if speed_clim_manual is None else speed_clim_manual[1]

for file in os.listdir(data_path):
    if not file.endswith(".h5"):
        continue

    file_path = os.path.join(data_path, file)
    sample_name = os.path.splitext(file)[0].split("_")[0]
    print(f"Processing: {file} -> sample: {sample_name}")

    with h5py.File(file_path, 'r') as f:
        data3D = np.array(f["3Dskeleton/data3D"])
        bodyparts = [bp.decode('utf-8') for bp in f["3Dskeleton/Bodyparts"][:]]
        fps = float(f["3Dskeleton/FPS"][()])

    if "back" not in bodyparts:
        print(f"⚠️ 'back' not found in {file}")
        continue
    back_idx = bodyparts.index("back")
    back_xyz = data3D[:, back_idx*3:(back_idx+1)*3] / 10.0

    smoothed = savgol_filter(back_xyz, window_length=savgol_window, polyorder=savgol_poly, axis=0)
    filtered = np.zeros_like(smoothed)
    for i in range(3):
        filtered[:, i] = butter_lowpass_filter(smoothed[:, i], butter_cutoff, fps, butter_order)

    velocity = np.gradient(filtered, axis=0) * fps
    speed = np.linalg.norm(velocity, axis=1)

    # ============================
    # 绘制速度轨迹热图
    # ============================
    plt.figure(figsize=(7.5, 6))
    sc = plt.scatter(filtered[:, 0], filtered[:, 1], c=speed, cmap='RdBu_r', s=2)
    sc.set_clim(0, global_speed_max)
    plt.gca().set_facecolor('white')
    plt.axis('off')
    cbar = plt.colorbar(sc)
    cbar.set_label("Speed (cm/s)")
    plt.tight_layout()
    base_name = f"{sample_name}_speed_traj_heatmap"
    for ext in ["png", "svg", "pdf"]:
        plt.savefig(os.path.join(save_path, f"{base_name}.{ext}"), dpi=300,
                    bbox_inches='tight', pad_inches=0.1)  # 留白加大
    plt.close()

    # ============================
    # 绘制位置热图
    # ============================
    x = filtered[:,0]; y = filtered[:,1]
    x = x[~np.isnan(x)]; y = y[~np.isnan(y)]
    x = x - x.min(); y = y - y.min()

    ptsX = np.linspace(0, x.max(), 500)
    ptsY = np.linspace(0, y.max(), 500)

    # 2D histogram
    H, _, _ = np.histogram2d(x, y, bins=[ptsX, ptsY], density=True)
    H_smooth = gaussian_filter(H.T, sigma=15)  # 高斯平滑

    plt.figure(figsize=(7.5,6))
    im = plt.imshow(H_smooth, origin='lower',
                    extent=[ptsX[0], ptsX[-1], ptsY[0], ptsY[-1]],
                    cmap=colormap,
                    vmin=pos_clim_manual[0],
                    vmax=pos_clim_manual[1],
                    aspect='equal')
    plt.gca().set_facecolor(colormap(0))  # 底色蓝色
    plt.axis('off')
    cbar = plt.colorbar(im)
    cbar.set_label('Probability')
    plt.tight_layout()
    base_name = f"{sample_name}_position_heatmap"
    for ext in ["png","svg","pdf"]:
        plt.savefig(os.path.join(save_path, f"{base_name}.{ext}"),
                    dpi=300, bbox_inches='tight', pad_inches=0.1)
    plt.close()


    print(f"✅ Finished: {sample_name}")

print("\nAll samples processed and saved successfully!")
结果检查
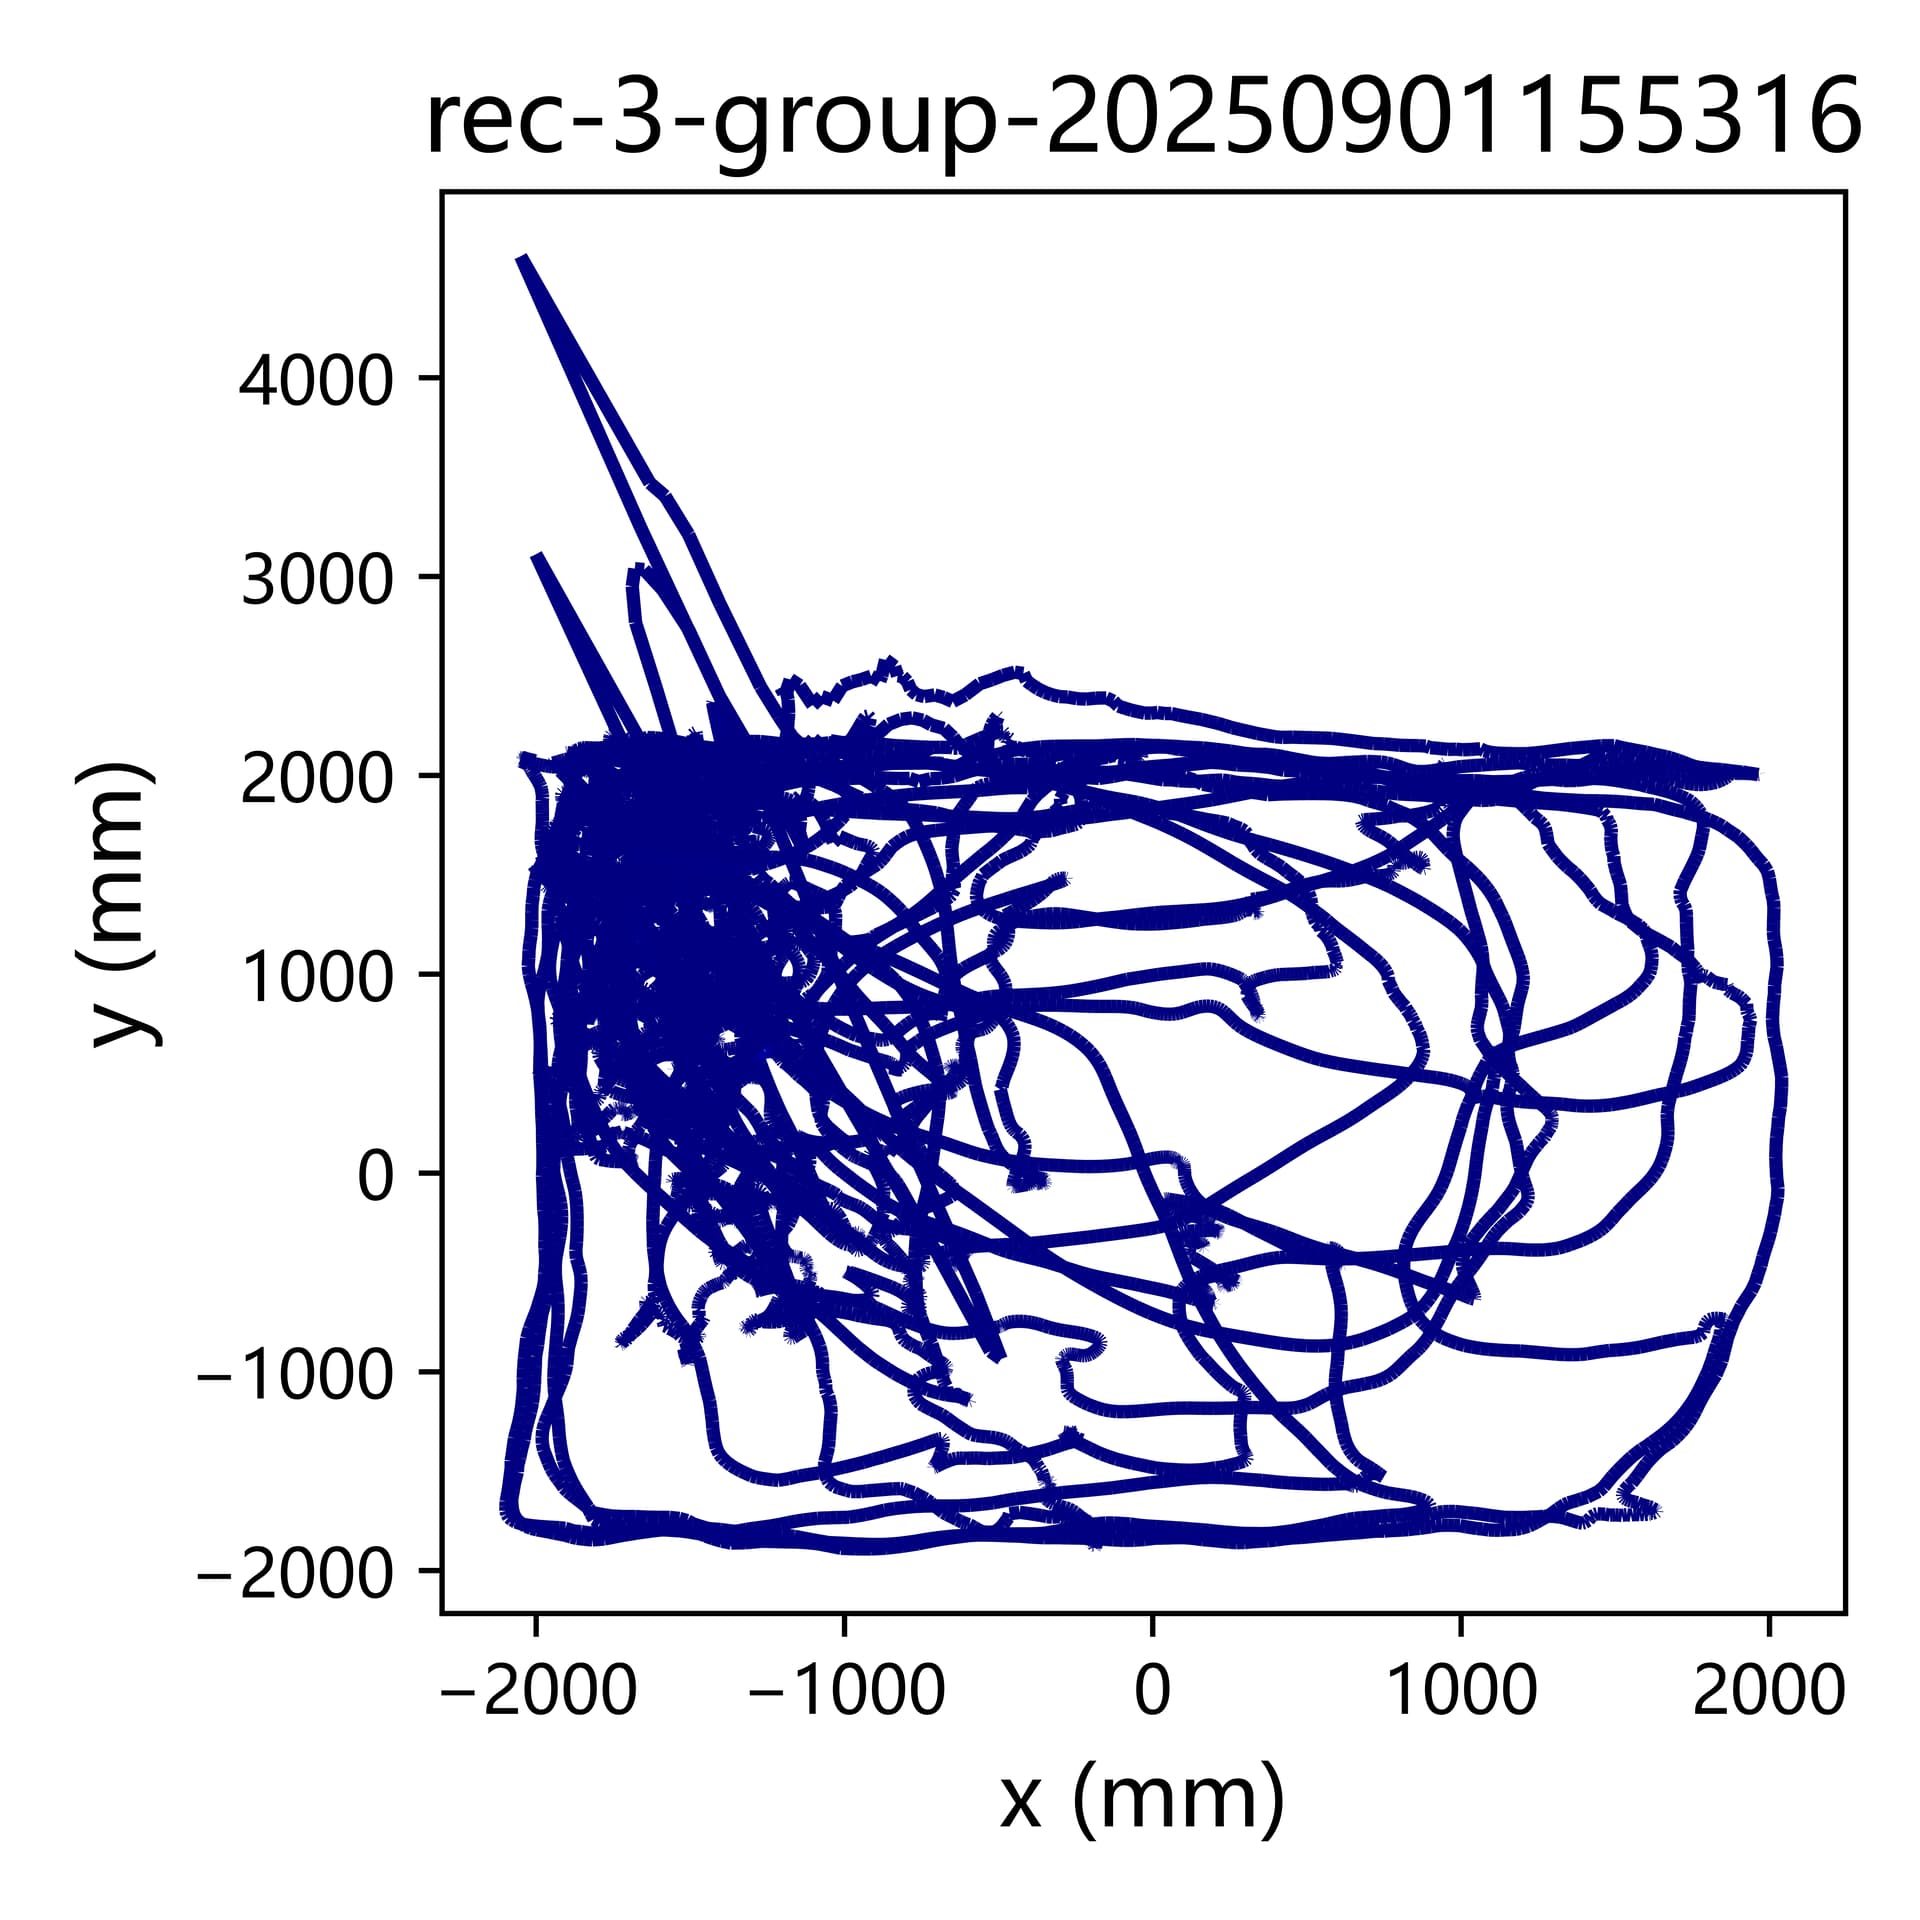
原始数据绘制的速度轨迹热图:
平滑滤波后的数据绘制的速度轨迹热图:

快来收获漂亮的样本速度轨迹热图及位置热图吧!